D3 is a pretty amazing data visualization library. I use its treemap visualization in my fundstew index fund holdings visualization project. I selected D3 for this use mostly based on its speed, which is far faster than any competing library I tried (Google Visualizations and JavaScript InfoVis Toolkit).
I had one problem, though: I really preferred the binary tree algorithm for laying out treemaps, at least for the sort of data I'm working with on my project. It divides the treemap roughly into quadrants (and sub-quadrants, and so on, recursively), which is helpful in getting a sense of the size and weighting of stock holdings.
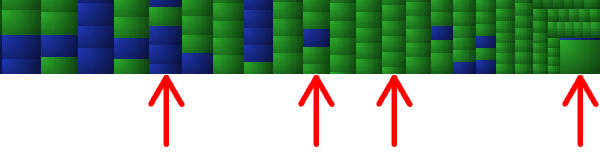
D3's "squarified" algorithm also seems to be a bit buggy. Some items (on the edges and corner with the smallest items) are displayed with a size that is either much larger or much smaller than it should be:
Here's a broader look at what the two different algorithms look like:
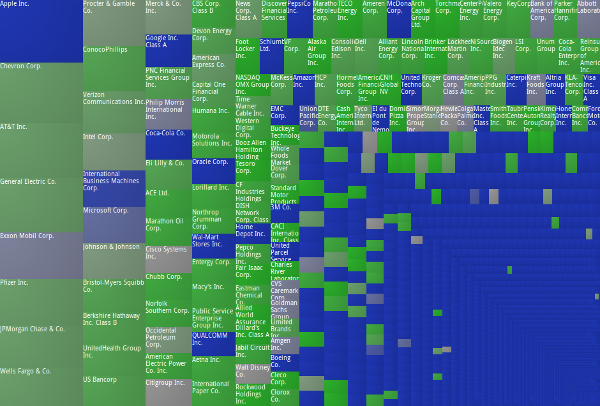
Squarified
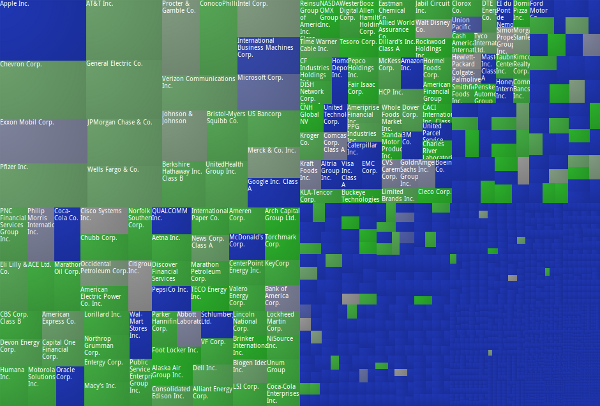
Binary tree
The code is not fully integrated into D3 yet, but if you don't mind a few rough edges, you can find it on Github via issue #653 for d3.
Nick Welch <nickwelch.dev@gmail.com> · github